M104 R4–7 MOS2 Fe-L Color Map Pilot
Point sources retained · exact ESAS QPB · spectrum-normalized soft protons and sky background
Back to the M104 R4–7 main report · Back to the eight-sector extraction / fit report
Executive verdict
This map is valuable, but its value is as an independent morphology cross-check and contamination diagnostic, not as a temperature map replacing the full spectral fit.
The primary product strictly retains point sources and uses
\[ R_{\rm FeL}= \frac{C(0.875-1.05\ {\rm keV})} {C(0.70-0.875\ {\rm keV})}, \]
The discrete event PI strictly uses low 700 <= PI < 875 (integer PI 700–874) and high 875 <= PI < 1050 (integer PI 875–1049); the matched exact-band QPB, MOS2-native soft protons, and response-folded sky background are then subtracted in counts space, and smoothed with exactly the same 60 arcsec Gaussian kernel for low/high. The results show:
- Inside R4–R7, the high Wind S ratio and lower Disk W ratio persist across 60 and 90 arcsec and the point-source included and masked controls; this is large-scale morphology worth continued spectral-fit testing.
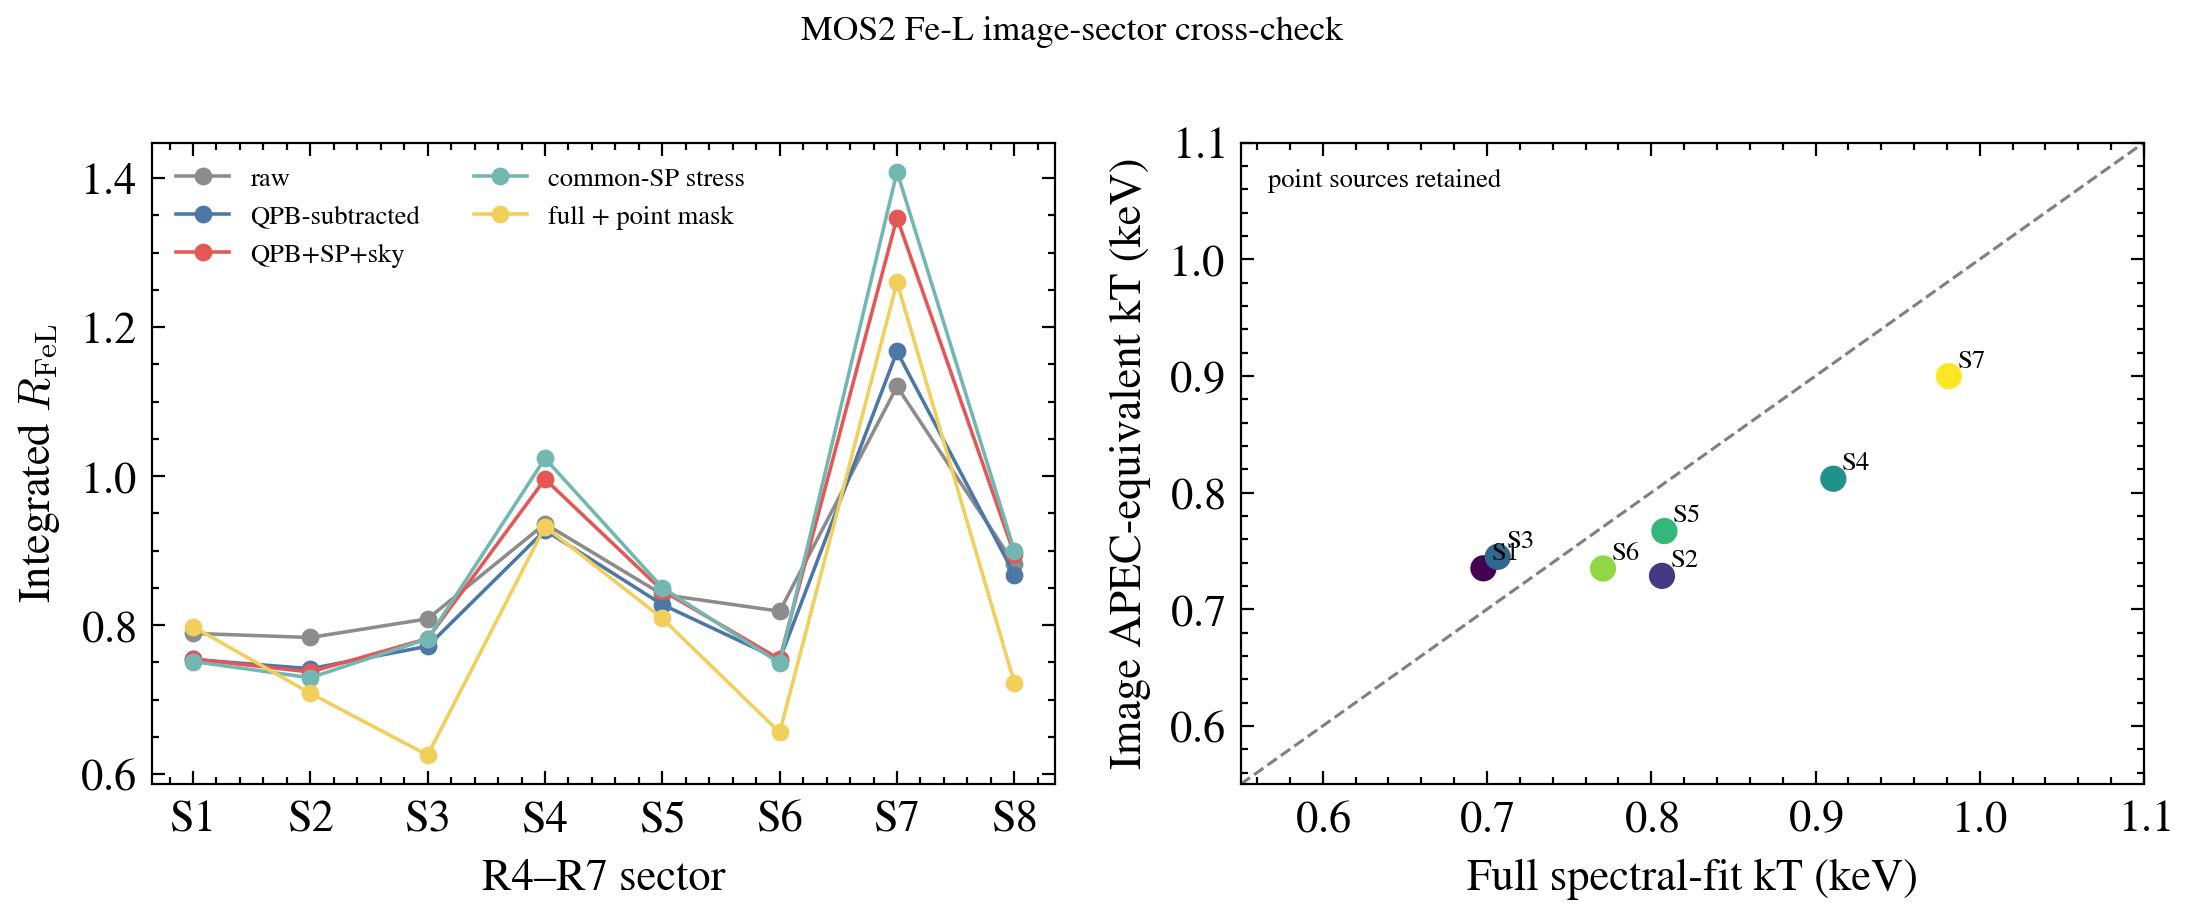
- With point sources retained, the eight-sector image ratio against the S1–S7 full-fit kT gives Spearman \(\rho=0.750\) (\(p=0.052\)); after applying the existing ESAS source mask it is \(\rho=0.786\) (\(p=0.036\)). Only 7 sectors are comparable; the p-values must not be taken as independent-discovery significance.
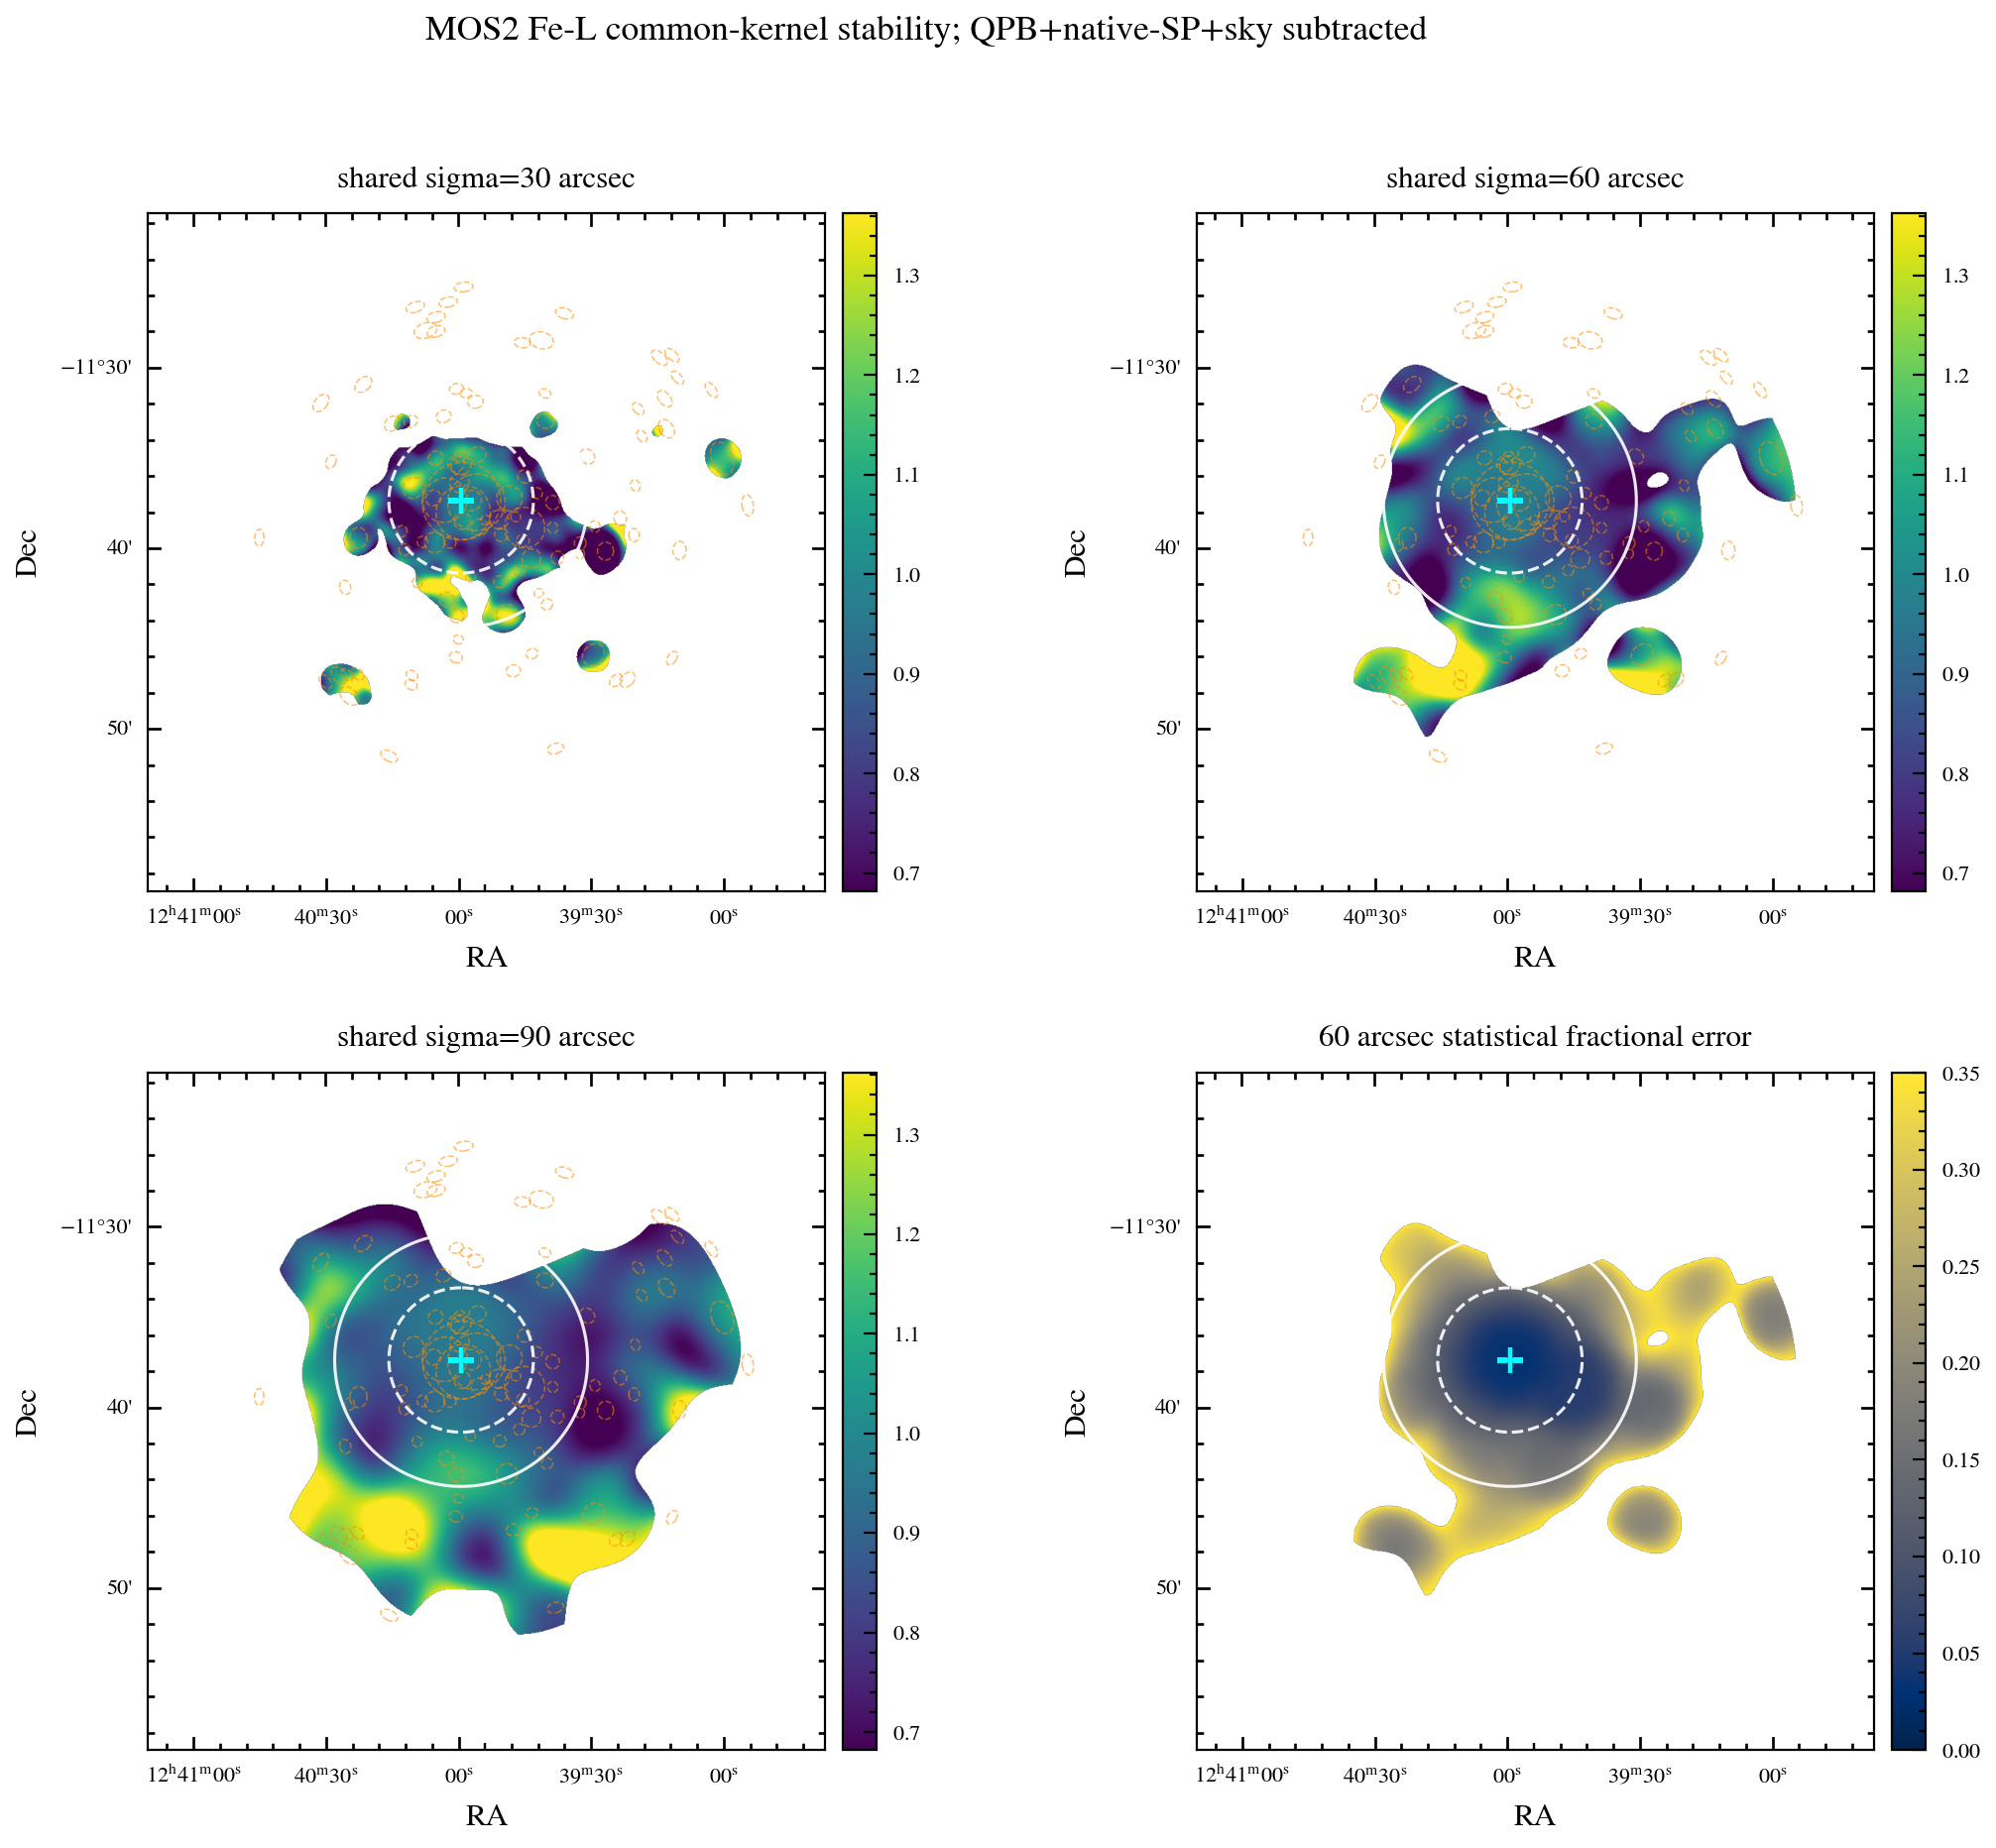
- 60 vs 90 arcsec morphology is highly stable: \(\rho=0.951\), median \(|\Delta R|=0.040\). The 30 arcsec version has too small an effective area and unstable detail, unsuited to the main conclusion.
- The integrated ratio of Wind S (S7) is \(1.366\pm16\%\); the point-source-masked control still gives \(1.284\pm23\%\). Its full spectral fit is \(kT=0.981\) keV, but that is a boundary-limited result, so it can only be called a consistent candidate signal.
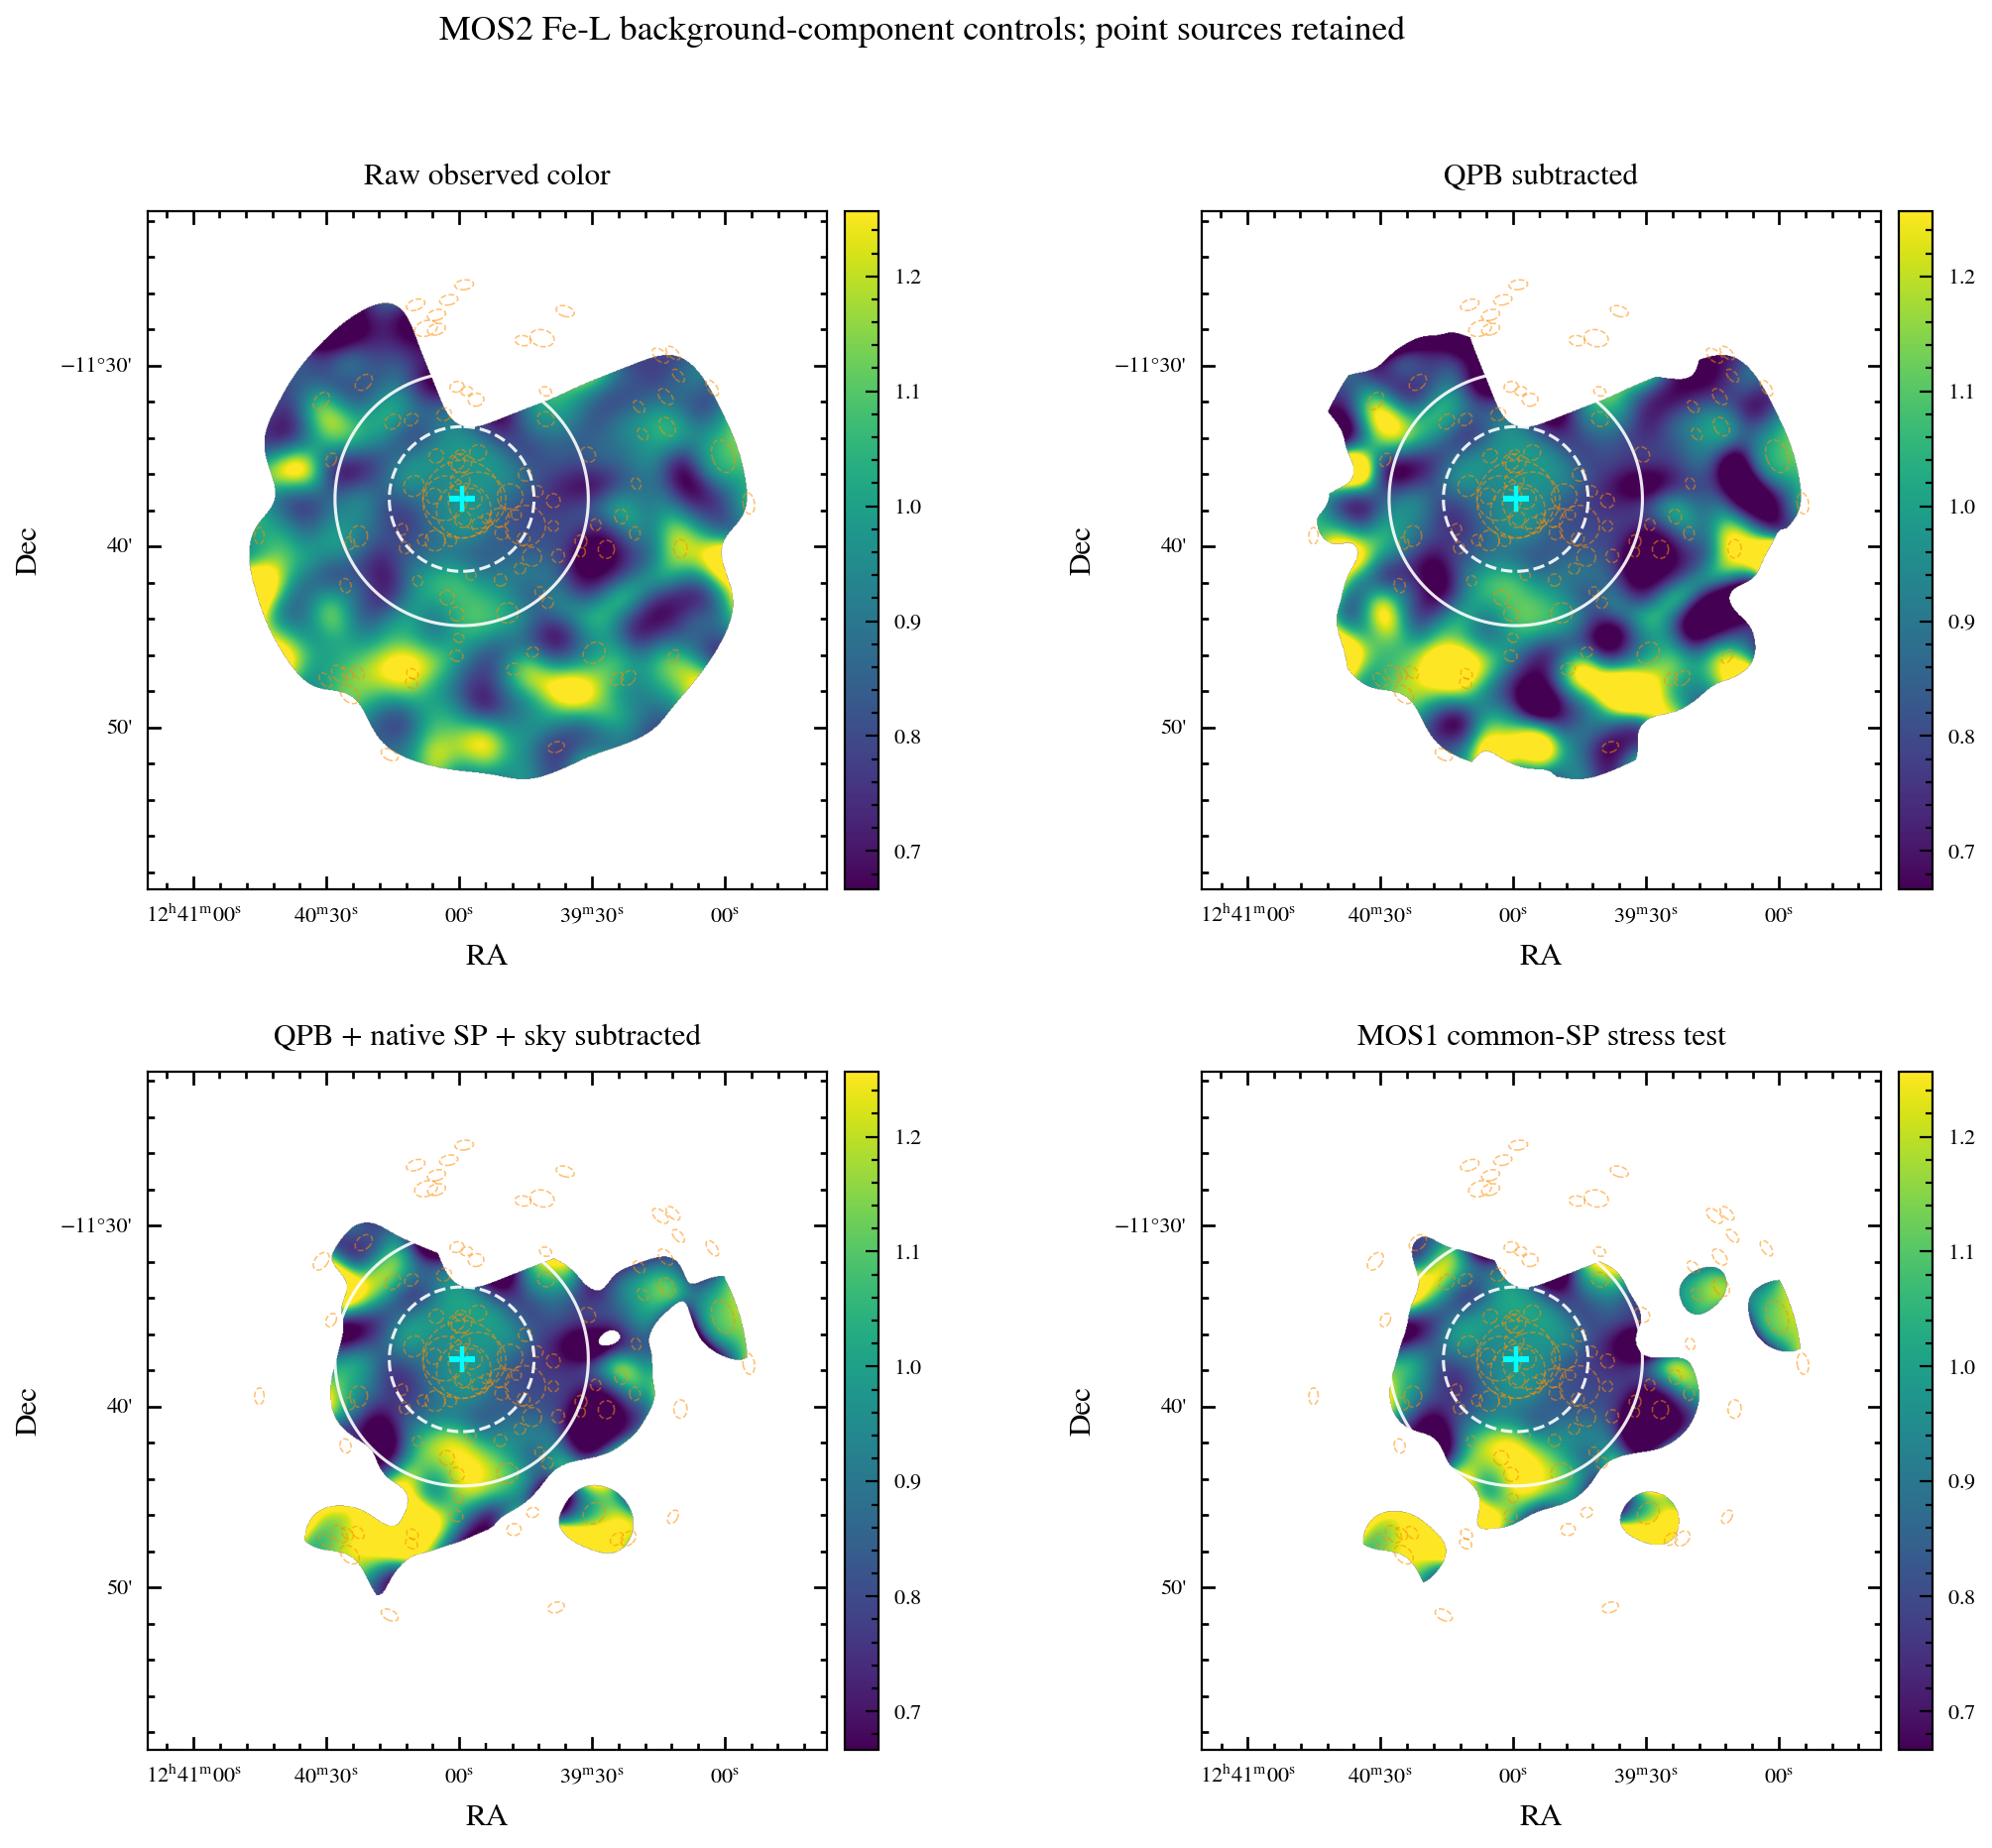
- SP is below 1% of the R0–15 raw counts in both bands; QPB and sky background are the dominant backgrounds. Projecting the MOS1-derived common-SP stress seed directly onto MOS2 would over-subtract by 17–22×, and it must not serve as the main SP image normalization.
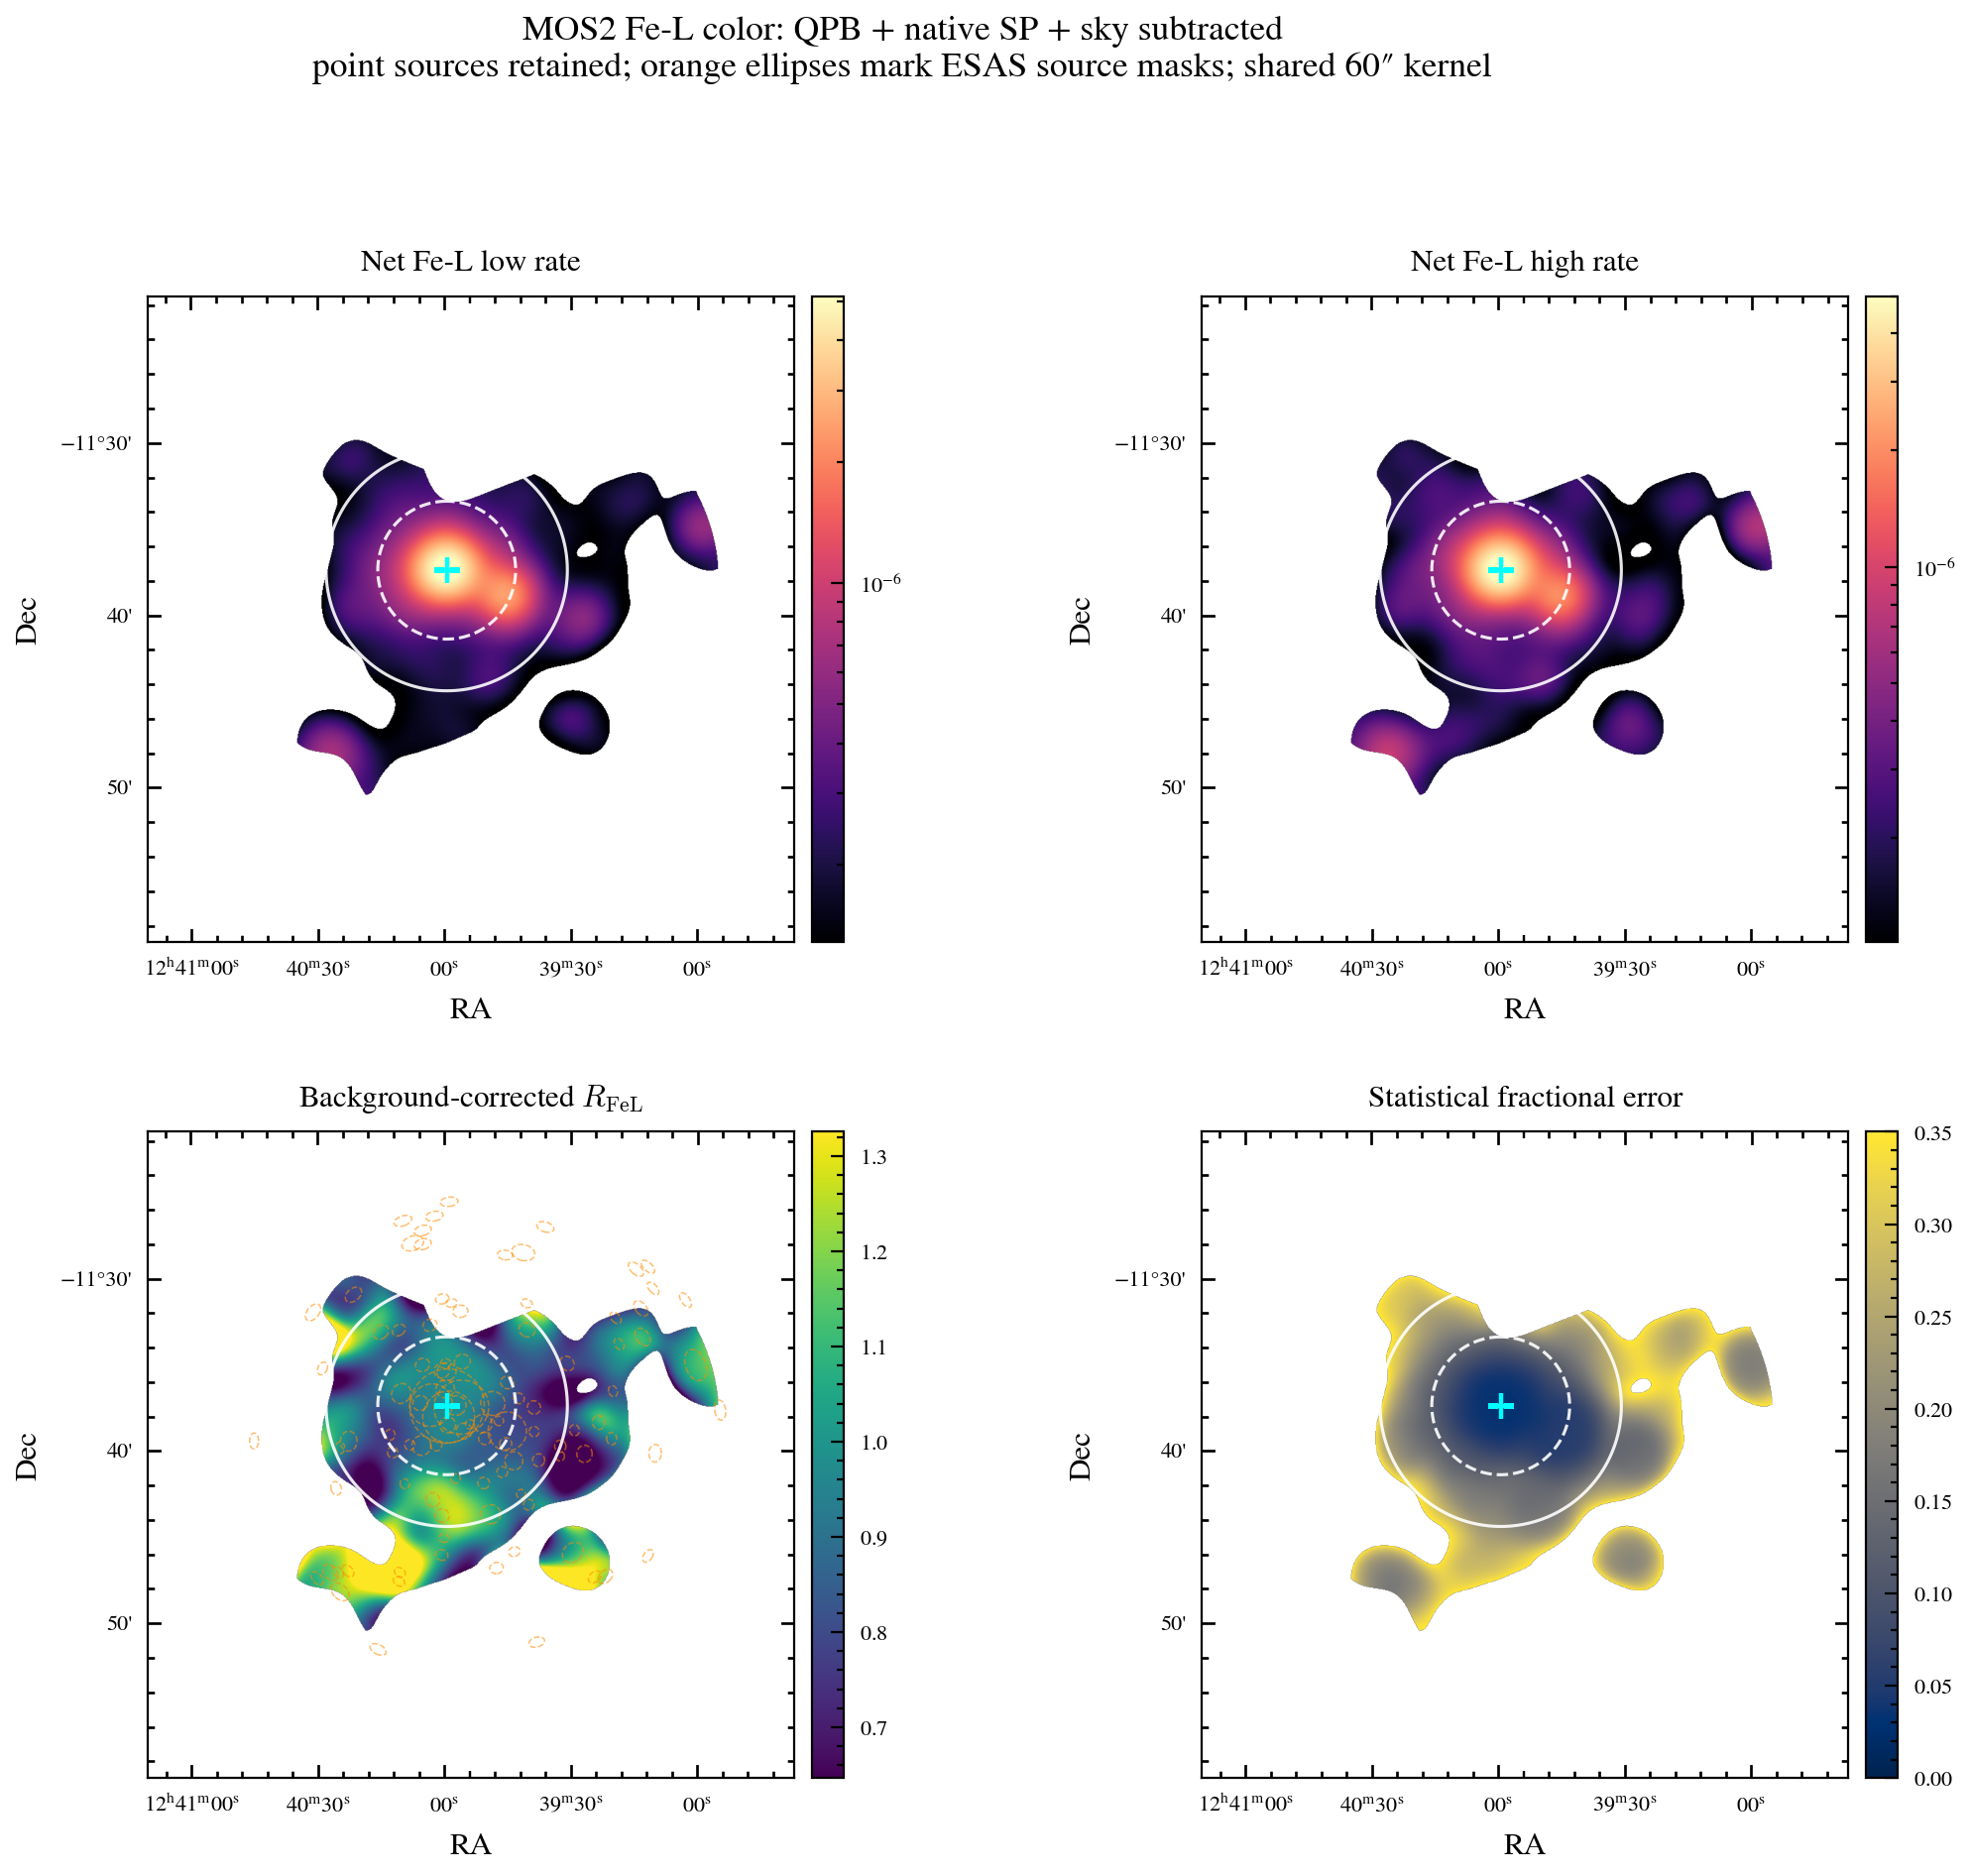
Component imaging
Each band first constructs
\[ N_i(x,y)=C_i-Q_i-P_i-B_{{\rm sky},i}-L_i, \]
then
\[ S_i(x,y)=\frac{K\ast N_i}{K\ast E_i}, \qquad R_{\rm FeL}=\frac{S_H}{S_L}. \]
Here \(K\) is exactly the same for both bands and all components.
QPB
mos-spectra mask=0generates full-FOV, point-source-included science products.mos_back elow/ehighgenerates detector-coordinate QPB images at the integer boundaries 700–874 and 875–1049, matching the half-open event selection.rot-im-det-sky mode=1rotates the QPB onto sky WCS.- QPB is not a mirror-vignetted sky photon; it is subtracted in counts space first, then divided by the photon exposure map.
- Authoritative-grid full-map counts: low 1,602.69, high 1,567.99.
Residual soft protons
proton spectrumcontrol=2uses the dedicated MOS2 SP detector template;rot-im-det-sky mode=2rotates it to sky.- The Sherpa model multiplies the SP surface norm by the sky area, so the
bnormpassed toprotonmust be \(334.9896\times3.6361\times10^{-6}=1.21805\times10^{-3}\); the surface norm must not be passed directly. - The generated template is then normalized to the R0–15 response-folded native-MOS2 counts: low scale=1.3065, high scale=1.3347.
- The final full-map SP counts are only 21.21 and 21.67, with little effect on the main morphology.
Vignetted sky background
Local Bubble, Galactic foreground, and CXB are treated with sky-uniform surface brightness:
\[ B_{{\rm sky},i}(x,y)=\beta_iE_i(x,y). \]
\(\beta_i\) is set by the R0–15 real-MOS2 response-folded model counts and the BACKSCAL area. The full-map counts are low 1,314.96, high 984.25.
R0–15 spectral closure
| Band | Raw PHA | QPB | M104 APEC | Sky | Residual lines | Native SP | Model/raw closure |
|---|---|---|---|---|---|---|---|
| 0.70–0.875 keV | 2,188 | 902.29 | 415.22 | 861.86 | 13.89 | 13.51 | +0.9% |
| 0.875–1.05 keV | 1,941 | 878.95 | 374.43 | 645.10 | 21.94 | 13.84 | −0.4% |
This shows the native MOS2 background topology closes in both bands; the MOS1 common-SP stress seed does not.
Smoothing-scale stability
Running adapt separately for low/high and then dividing is not allowed, because the two bands would acquire different spatial transfer functions. This pilot fixes one shared Gaussian kernel and checks 30, 60, 90 arcsec.
| Shared sigma | Comparison | Spearman \(\rho\) | Median \(|\Delta R|\) | 95th percentile \(|\Delta R|\) |
|---|---|---|---|---|
| 30 vs 60 arcsec | R4–R7 common-valid pixels | 0.791 | 0.093 | 0.294 |
| 30 vs 90 arcsec | R4–R7 common-valid pixels | 0.669 | 0.114 | 0.378 |
| 60 vs 90 arcsec | R4–R7 common-valid pixels | 0.951 | 0.039 | 0.126 |
60 arcsec is therefore the primary version balancing spatial resolution and statistical stability; only large-scale structure appearing at both 60/90 deserves further interpretation.
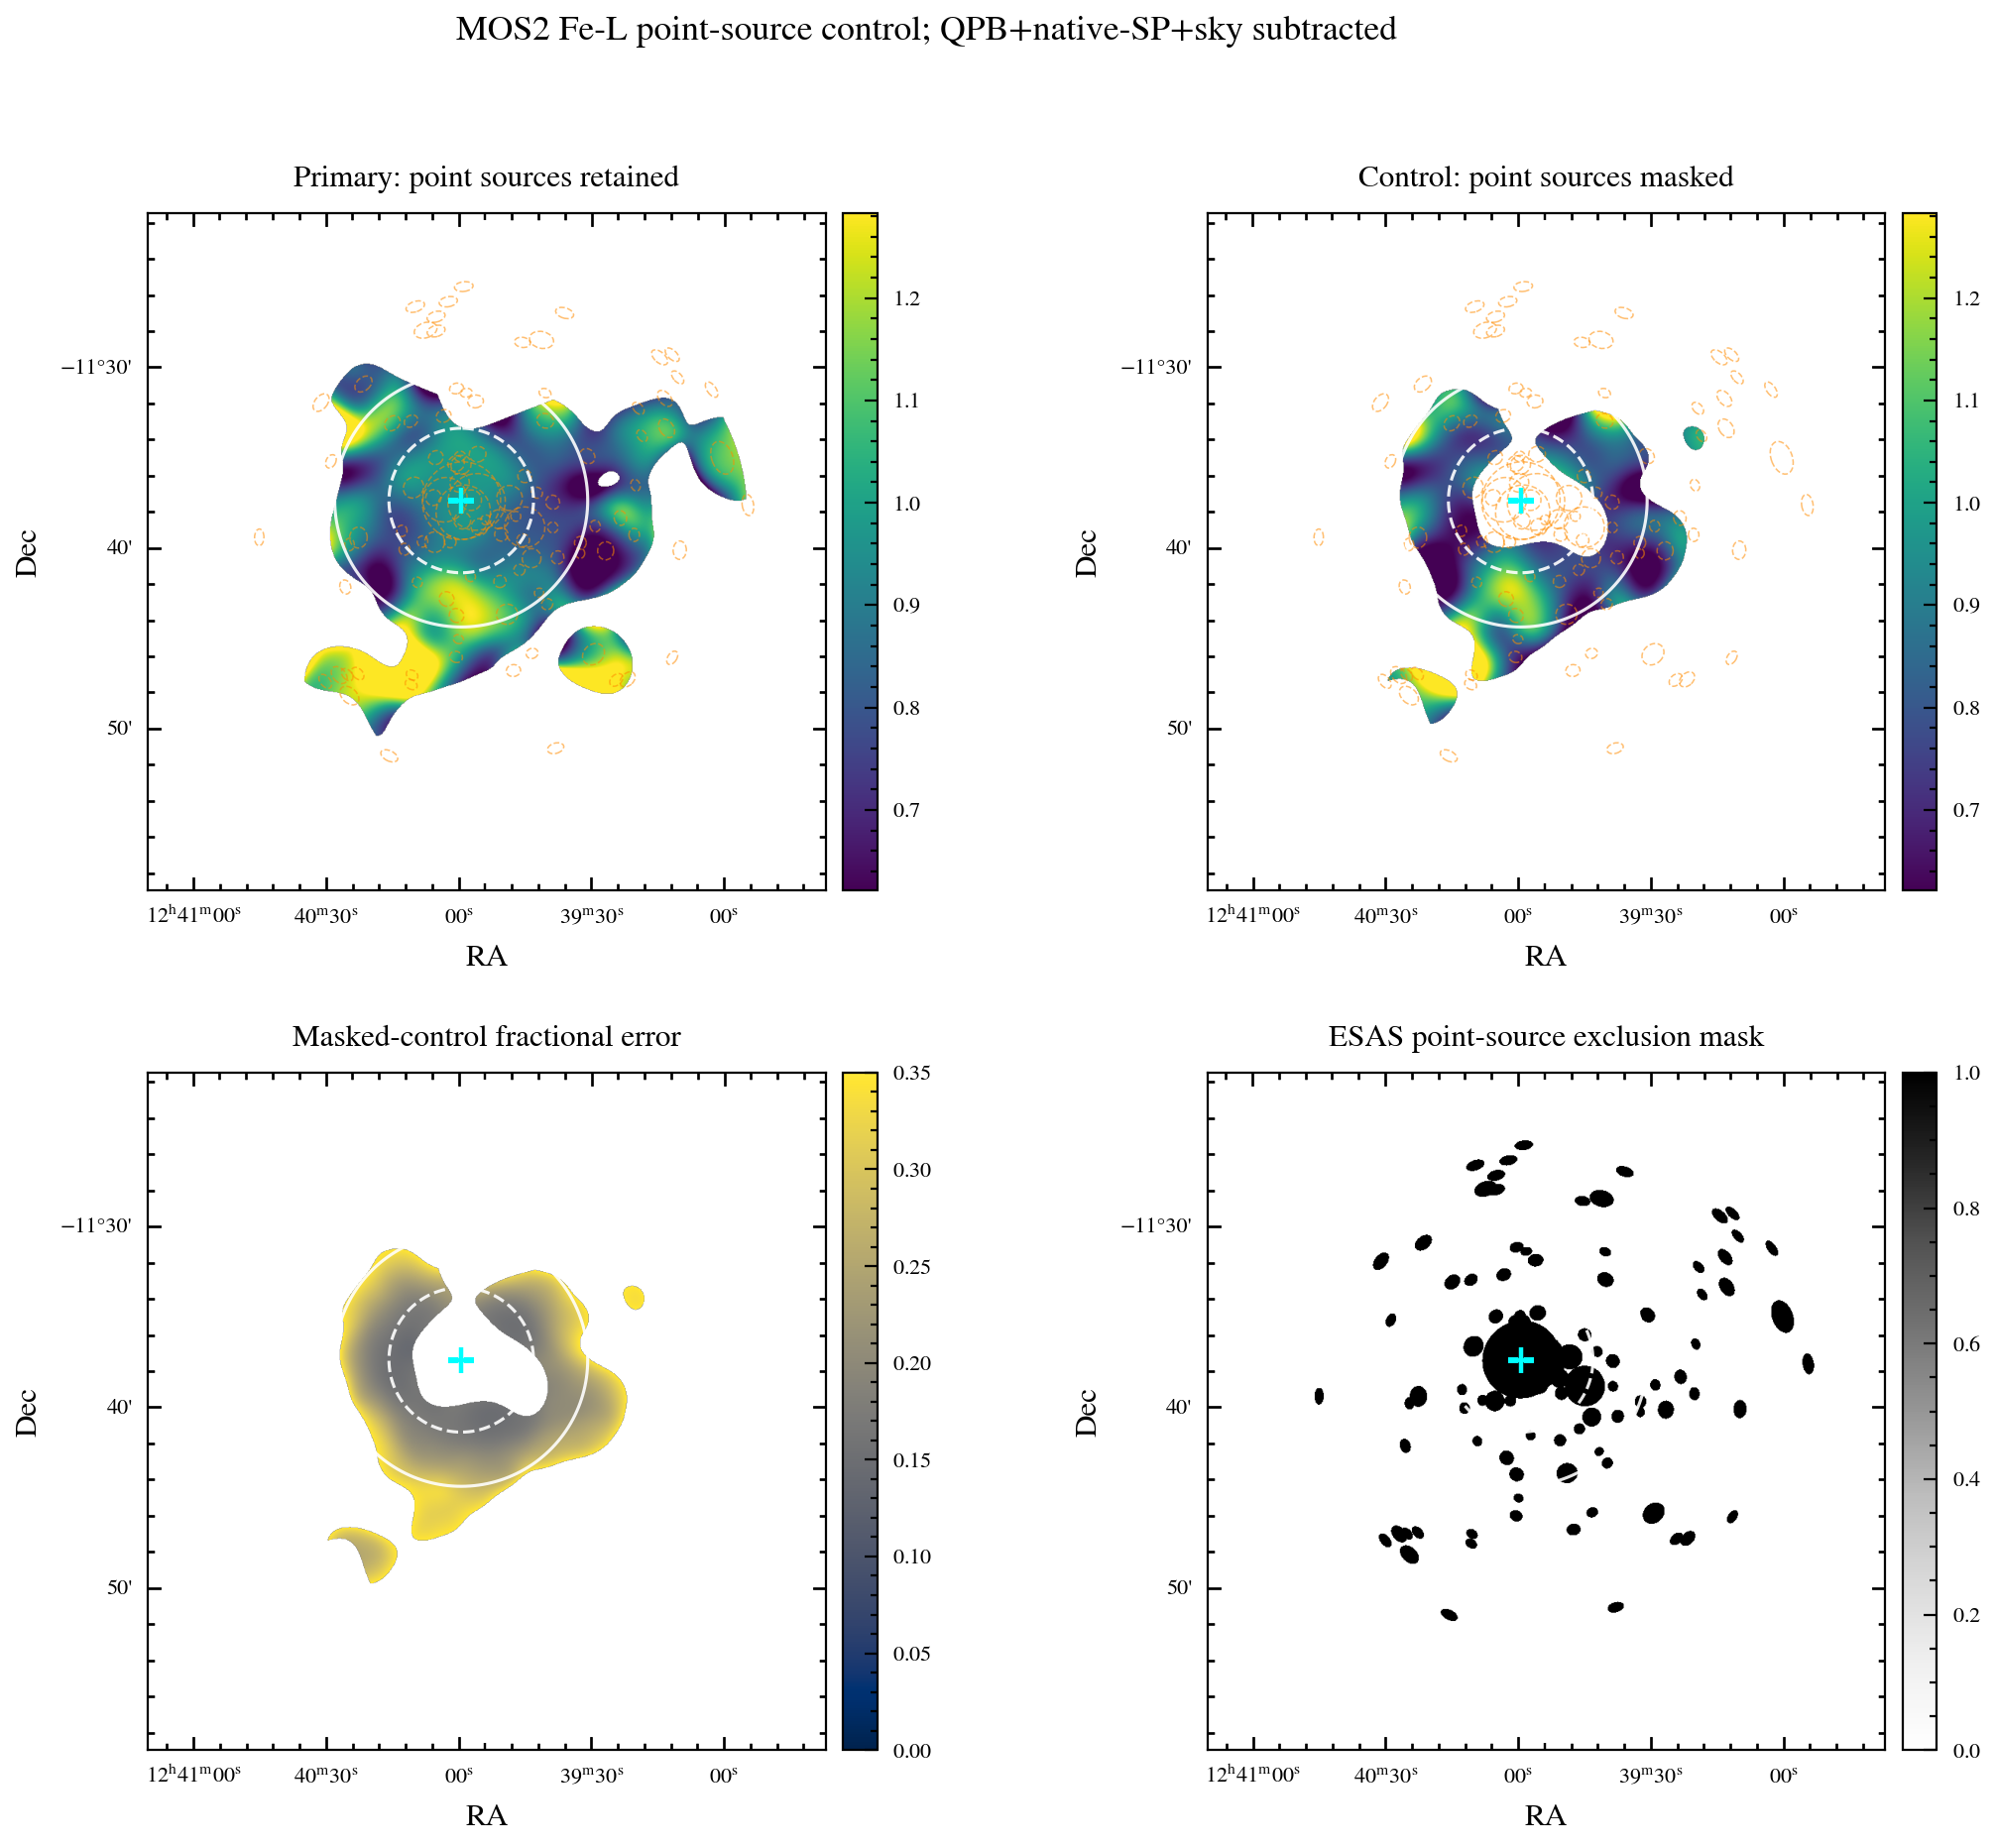
Point-source control
The primary product retains point sources as required. To judge whether the large-scale color is entirely point-source driven, a companion control was made: the same 102-region ESAS cheese mask applied to low/high counts, QPB, SP, sky, and exposure, then the same 60 arcsec kernel.
- 6,745 pixels masked inside R4–R7.
- The included and masked ratios over common-valid pixels give \(\rho=0.857\), median \(|\Delta R|=0.054\).
- The high Wind S ratio and lower Disk W ratio persist; many small-scale hotspots and central structure disappear.
- The masked control is not the primary product; it only shows the large-scale ordering is not entirely caused by point sources.
R4–R7 sector cross-check
The ratios below are obtained by integrating net counts and exposure directly within each 45-degree sector, not by averaging smoothed ratio pixels.
| Sector | Role | Full ratio | Statistical frac. error | Point-masked ratio | Point-masked frac. error | Full-fit kT (keV) |
|---|---|---|---|---|---|---|
| S1 | Disk W | 0.749 | 13.8% | 0.788 | 21.0% | 0.698 |
| S2 | NW transition | 0.721 | 22.4% | 0.688 | 26.7% | 0.807 |
| S3 | Wind N | 0.781 | 47.4% | 0.623 | 77.6% | 0.707 |
| S4 | NE transition | 0.996 | 21.2% | 0.932 | 24.5% | 0.911 boundary-limited |
| S5 | Disk E | 0.846 | 17.4% | 0.809 | 21.8% | 0.808 |
| S6 | SE transition | 0.761 | 21.4% | 0.663 | 25.5% | 0.771 |
| S7 | Wind S | 1.366 | 16.4% | 1.284 | 23.4% | 0.981 boundary-limited |
| S8 | SW transition | 0.898 | 11.6% | 0.743 | 19.3% | unavailable |
S3's fractional error in the point-source-masked control reaches 77%, unusable for morphology. S7's high ratio is the most stable, but its spectral fit is also near the high-temperature boundary, so it still needs normal/confidence and multi-observation/multi-camera verification.
Caveats
- With point sources retained, the ratio mixes thermal gas, AGN/XRB power-laws, and PSF wings; no local \(kT\) interpretation holds.
- Even point-masked, the ratio→kT mapping still depends on NH, abundance, APEC/AtomDB, and response, and the background posterior has not yet been propagated per-pixel by Monte Carlo.
- The current fractional-error map propagates only the raw-count Poisson term; QPB corner normalization, FWC finite counts, sky-fit posterior, SP-template, and residual-line systematics must be added in the formal version.
- This is display-level background-corrected morphology, not a joint-Poisson posterior inference map; the low-band \(Z\ge3\) profile-likelihood gate, background nuisance draws, independent-beam FDR, and before/after GTI time split are not yet done, so there is no pixel-level detection significance.
- The R4–R7 sector comparison and the spectral fit use the same observation and cannot be viewed as fully independent validation.
- The full-fit kT of S4 and S7 is boundary-limited; S8 has no qualified spectrum.
- The conclusions only support a "Wind S hard/high-Fe-L-ratio candidate" and the large-scale color asymmetry, not a measured 2-D temperature field.
Reproducibility issue solved
The old project wrapper fkeypar on this machine reads only the FITS primary HDU, while mos-spectra reads LIVETI0n from the EVENTS extension; the result was a division by zero on CCD2. Two parallel tasks also shared the same /tmp/fkeypar_last_value.txt, a race condition. This pilot uses a project-local, per-workdir fkeypar/pget compatibility layer; the SAS installation was not modified.
Discrete PI half-open correction
The first version used the inclusive semantics of SAS PI in [lo:hi], so 50 events at PI=875 entered both low/high and 29 events at PI=1050 fell beyond the nominal upper limit. That version is archived and superseded. The current version uses 8430 low events and 7698 high events, with matching QPB/SP images regenerated.
The R4–R7 common-valid ratio morphology before vs after the correction remains highly consistent: \(\rho=0.9978\), median \(|\Delta R|=0.0058\), 95th percentile \(|\Delta R|=0.0232\); the largest sector full-ratio change is 0.01895. The science morphology does not substantively flip, but strict band provenance requires the current half-open release.
Independent Claude Code Opus audit
Claude Code Opus 4.8, high effort, ran two read-only independent audits of the historical 2-sector, R4–R7 4-sector, axis-centered 8-sector/7-fit, and the current band-ratio. The second round read back the post-half-open-rebuild FITS headers, HDU counts, QPB/SP hashes, sector CSV, and focused tests directly.
- Current band-ratio release: PASS, but limited to the corrected color-morphology cross-check; it is not a 2-D temperature or significance map.
- 8-sector spectral publication: REQUEST_CHANGES. The current S4/S7 are limited by
kT.max=1.0, and the release is still FAST triage without final normal/2D confidence. - The 4-sector gives Wind N/S=0.780/0.760 keV while the 8-sector gives 0.707/0.981 keV — the N–S ordering flips with binning. A quantitative "Wind S hotter by 0.27 keV" conclusion therefore cannot be published.
- The next step must refit 4/8-sectors under a unified MOS2-only contract with identical filter/background/grouping/free-state, raise the kT ceiling to at least 1.5 keV, and run final confidence.
Downloads
Figure files

Component images and provenance
- QPB low half-open FITS, PI 700–874
- QPB high half-open FITS, PI 875–1049
- Soft-proton low half-open FITS, PI 700–874
- Soft-proton high half-open FITS, PI 875–1049
- Spectral component contract JSON
- Input/hash inventory JSON
- Method contract
- Claude Code Opus high-effort independent audit
- Independent-audit brief